STEM-104 Group Project 2
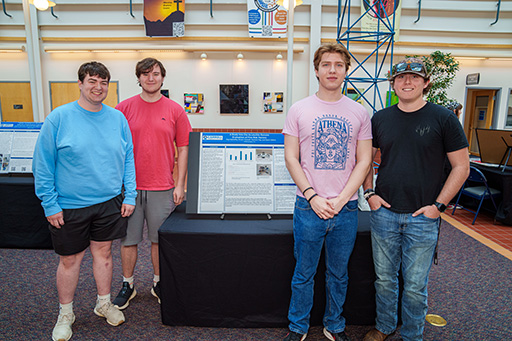
Participants: Paul Mahaffey, Brison Tichnell, Dominic Day, and Gavin Dalton
Course: STEM Scholars 7.0
Professor:
Assignment Title: A Study Into the Accessible Remote Evaluation of Fire Risk Factors
Assignment Details
Carroll County is largely rural, so much of its land is used for farming. Agricultural business is at the center of the county’s economy, so minimizing the potential risk factors of natural damage is of high importance. Humidity and temperature have been researched with scholarly articles as sources to establish a link to potential wildfire damage. With this connection, our project seeks to identify areas of considerable risk (low humidity). Humidity is usually measured in relative humidity percent; people can manually survey land to obtain these numbers, but the operation is often exhaustive. To make the process of obtaining fire risk data safer and quicker, this could be done remotely by drone. The team designed and printed a three-dimensional (3D) polylactic acid (PLA) carbon fiber harness to affix a humidity sensor to a drone. A control board on the harness with humidity sensing capabilities was used to calculate the data, and data will be transmitted to a secondary device using Bluetooth. Excel was used to process and evaluate the data received from test scenarios. Testing consisted of monitoring the data gathered from the drone’s flight over different simulated environments of extremely high and low humidity. These closed environments are created with a humidifier and dehumidifier, respectively.
Results/Conclusions
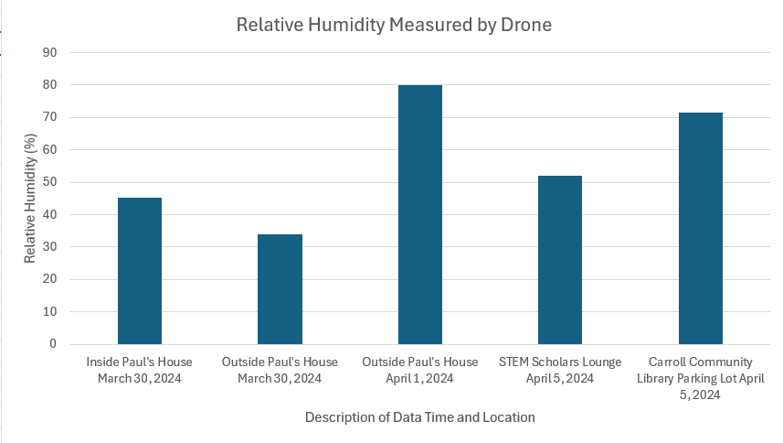
The red line at 30% relative humidity in Fig. 1 shows the ‘danger level’ for wildfire risks. The American Meteorologist Society says that humidity percentages below this level pose an increased risk for the Northeastern United States. The data collected shown in Fig. 1 does not contain any values below this level. This does not mean a wildfire is impossible to occur at these times on these days; however, it is unlikely for a wildfire to break out. This conclusion assumes that other factors such as temperature, atmospheric stability, precipitation, and winds are at safe levels. These collected data points were verified by comparing to weather apps and third-party humidity sensors, with minimal error.
The data collected shows decreased wildfire risk in the areas tested, with confidence that the humidity data collected is reliable and accurate. Going further, the team would like a more robust design and a larger range of remote connectivity to the Arduino. This would be achieved through a chassis that completely envelopes the circuitry, along with a board and program able to obtain long range wireless connection.
Challenges and Successes
- The Arduino board had issues connecting remotely to the laptop.
- The humidity sensor was not being detected in either MATLAB or Arduino IDE.
- When 3D printing the harness, we had issues with breakage and weak points.
- The range of the Bluetooth connection is very limited, to about 20 feet from the user.
- The team overcame these challenges by working solely in Arduino IDE with revamped code to get the humidity sensor working. With a redesign to the harness and an alteration to the printing settings (increasing the infill and decreasing the print speed), the harness is now stable and sturdy. The connection range was not able to be extended, due to the limitations provided by using low energy Bluetooth.